Abstract
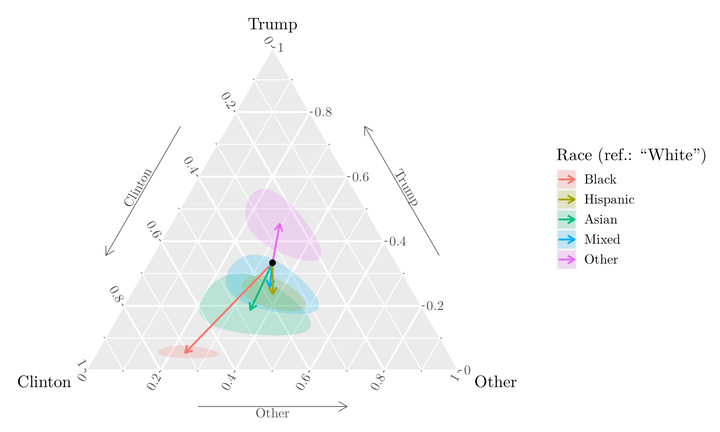
This paper presents the R package plot3logit which enables the covariate effects of trinomial regression models to be represented graphically by means of a ternary plot. The aim of the plot is helping the interpretation of regression coefficients in terms of the effects that a change in values of regressors has on the probability distribution of the dependent variable. Such changes may involve either a single regressor, or a group of them (composite changes), and the package permits both cases to be handled in a user-friendly way. Moreover, plot3logit can compute and draw confidence regions of the effects of covariate changes and enables multiple changes and profiles to be represented and compared jointly. Upstream and downstream compatibility makes the package able to work with other R packages or applications other than R.