Abstract
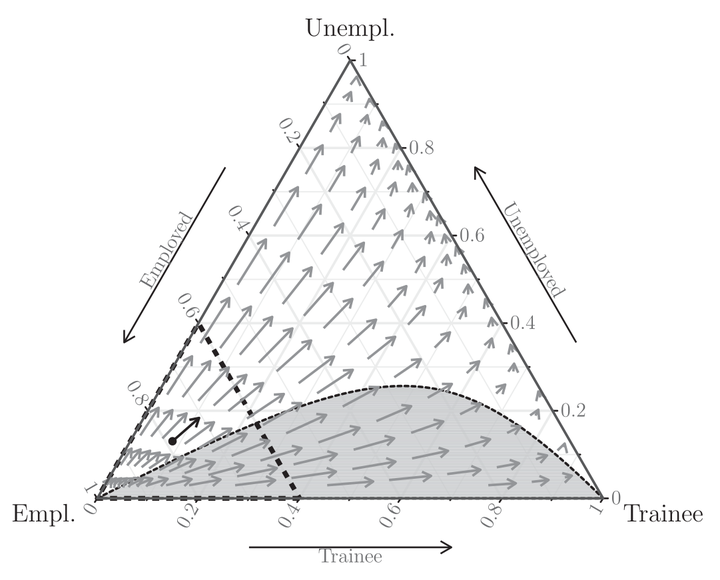
Multinomial logit (also termed multi-logit) models permit the analysis of the statistical relation between a categorical response variable and a set of explicative variables (called covariates or regressors). Although multinomial logit is widely used in both the social and economic sciences, the interpretation of regression coefficients may be tricky, as the effect of covariates on the probability distribution of the response variable is nonconstant and difficult to quantify. The ternary plots illustrated in this article aim at facilitating the interpretation of regression coefficients and permit the effect of covariates (either singularly or jointly considered) on the probability distribution of the dependent variable to be quantified. Ternary plots can be drawn both for ordered and for unordered categorical dependent variables, when the number of possible outcomes equals three (trinomial response variable); these plots allow not only to represent the covariate effects over the whole parameter space of the dependent variable but also to compare the covariate effects of any given individual profile. The method is illustrated and discussed through analysis of a dataset concerning the transition of master’s graduates of the University of Trento (Italy) from university to employment.